Single-cell pseudobulk differential expression with pylimma (Kang 2018 PBMC)
AnnData-native walk-through of a pseudobulk limma/voom workflow on the Kang 2018 PBMC IFN-beta stimulation dataset. The workflow: aggregate counts per (donor, condition, cell_type), run pylimma’s standard pipeline per cell type, extract IFN-beta response contrasts.
Dataset: Kang HM et al. (2018). Nat Biotechnol 36:89-94. Multiplexed droplet single-cell RNA-seq of PBMCs from 8 lupus patients, with and without IFN-beta stimulation. ~25k cells x ~16k genes across 8 annotated immune cell types.
Why pseudobulk in one line: when the experimental unit is a donor rather than a cell, cell-level DE tests treat every cell as independent and inflate their test statistics. Pseudobulking per (donor, cell type) restores the correct sample size. Squair et al. 2021 (Nat Commun 12:5692) and Crowell et al. 2020 (Nat Commun 11:6077) are the canonical references; pseudobulk + limma/voom is in the top tier of both benchmarks.
Pipeline
Load the real Kang AnnData (pertpy preferred, figshare fallback)
tSNE visualisation (uses the pre-computed embedding)
Pseudobulk per (donor, condition, cell_type)
pylimma per cell type:
voom->lm_fit->contrasts_fit->e_bayes->top_tableTop IFN-beta response genes per cell type
[1]:
import sys
import warnings
from pathlib import Path

import anndata as ad
import matplotlib.pyplot as plt
import numpy as np
import pandas as pd
import scanpy as sc

warnings.filterwarnings('ignore', category=FutureWarning)
warnings.filterwarnings('ignore', category=DeprecationWarning)

REPO = Path.cwd().resolve().parents[1]
sys.path.insert(0, str(REPO))
import pylimma

pd.set_option('display.width', 120)
pd.set_option('display.max_columns', 10)
/Users/John/miniconda3/lib/python3.11/site-packages/h5py/__init__.py:36: UserWarning: h5py is running against HDF5 1.14.3 when it was built against 1.14.2, this may cause problems
  _warn(("h5py is running against HDF5 {0} when it was built against {1}, "
1. Load the Kang 2018 AnnData
Preferred loader: pertpy.data.kang_2018(). It tracks the canonical Kang object and re-pins the source URL as needed (scverse-maintained).
Fallback: scanpy.read(..., backup_url=...) against the figshare mirror of the processed dataset used in the Heumos et al. 2023 Single-Cell Best Practices book. scanpy.read caches the file locally after the first download, so re-runs are network-free.
If the figshare URL ever 404s, the raw data lives at NCBI GEO (GSE96583) and pertpy is the scverse-maintained fallback for the processed object.
[2]:
kang_cache = Path.cwd() / 'kang_2018.h5ad'
try:
    import pertpy as pt
    adata = pt.data.kang_2018()
    print('loaded via pertpy.data.kang_2018()')
except ImportError:
    adata = sc.read(
        kang_cache,
        backup_url='https://ndownloader.figshare.com/files/34464122',
    )
    print(f'loaded via figshare mirror -> {kang_cache}')

# Processed Kang uses `label` for condition and `replicate` for donor;
# normalise to pylimma-friendly names.
adata.obs = adata.obs.rename(columns={'label': 'condition',
                                       'replicate': 'donor'})

print(f'\nAnnData shape: {adata.shape}  (cells x genes)')
print(f'conditions: {sorted(adata.obs["condition"].unique())}')
print(f'donors ({adata.obs["donor"].nunique()}): '
      f'{sorted(adata.obs["donor"].unique())}')
print(f'cell types ({adata.obs["cell_type"].nunique()}):')
print(adata.obs['cell_type'].value_counts())
loaded via figshare mirror -> /Users/John/Documents/Projects/staged/pylimma/pylimma/examples/kang_pbmc/kang_2018.h5ad

AnnData shape: (24673, 15706)  (cells x genes)
conditions: ['ctrl', 'stim']
donors (8): ['patient_101', 'patient_1015', 'patient_1016', 'patient_1039', 'patient_107', 'patient_1244', 'patient_1256', 'patient_1488']
cell types (8):
cell_type
CD4 T cells          11238
CD14+ Monocytes       5697
B cells               2651
NK cells              1716
CD8 T cells           1621
FCGR3A+ Monocytes     1089
Dendritic cells        529
Megakaryocytes         132
Name: count, dtype: int64
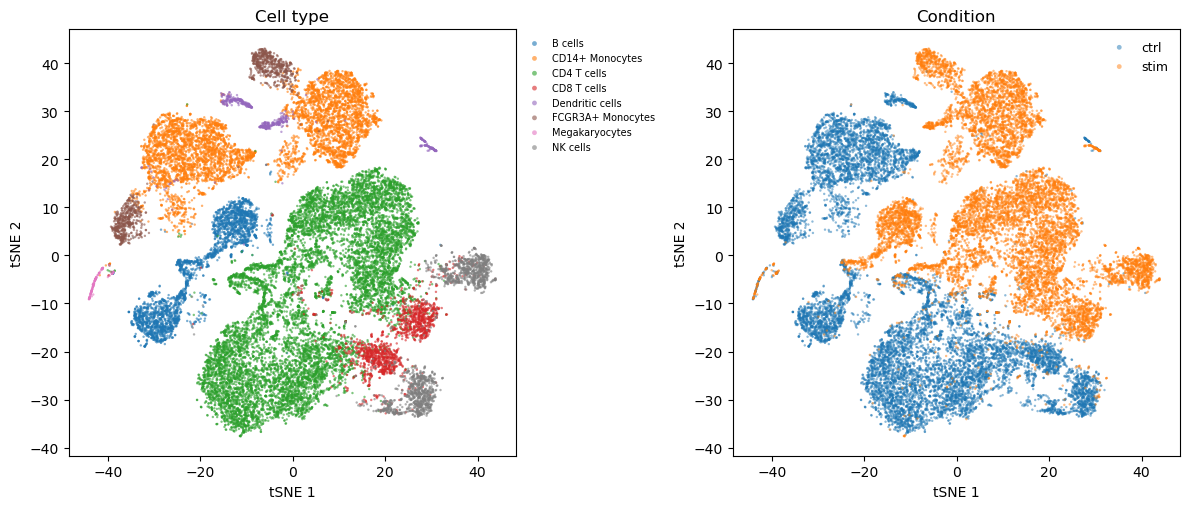
2. tSNE visualisation
The processed AnnData carries pre-computed tsne1 / tsne2 coordinates (from the original Seurat workflow the Kang paper used), so plotting is cheap.
[3]:
fig, (axCt, axCond) = plt.subplots(1, 2, figsize=(12, 5.2))

palette = plt.get_cmap('tab10').colors
cell_types = sorted(adata.obs['cell_type'].unique())
for k, ct in enumerate(cell_types):
    m = (adata.obs['cell_type'] == ct).values
    axCt.scatter(adata.obs.loc[m, 'tsne1'],
                 adata.obs.loc[m, 'tsne2'],
                 s=3, color=palette[k % len(palette)],
                 label=ct, edgecolor='none', alpha=0.6)
axCt.legend(fontsize=7, frameon=False, markerscale=2,
            bbox_to_anchor=(1.0, 1.0))
axCt.set_xlabel('tSNE 1'); axCt.set_ylabel('tSNE 2')
axCt.set_title('Cell type')

conditions = sorted(adata.obs['condition'].unique())
for k, cond in enumerate(conditions):
    m = (adata.obs['condition'] == cond).values
    axCond.scatter(adata.obs.loc[m, 'tsne1'],
                   adata.obs.loc[m, 'tsne2'],
                   s=3, color=palette[k], label=cond,
                   edgecolor='none', alpha=0.5)
axCond.legend(fontsize=9, frameon=False, markerscale=2)
axCond.set_xlabel('tSNE 1'); axCond.set_ylabel('tSNE 2')
axCond.set_title('Condition')

fig.tight_layout()
plt.show()
3. Pseudobulk
Sum raw counts per (donor, condition, cell_type) to produce one row per biological replicate. Uses a pandas groupby on adata.X - transparent and dependency-light. decoupler.get_pseudobulk is the scverse- standard equivalent if you prefer it. Keep replicates with at least 10 cells and 1,000 total counts to avoid noise-dominated rows.
[4]:
# Build a composite sample key and groupby directly.
keys = (adata.obs['donor'].astype(str) + '|' +
        adata.obs['condition'].astype(str) + '|' +
        adata.obs['cell_type'].astype(str)).values

# Row sums per group via pandas; handles sparse X via .dot with a
# one-hot indicator matrix (fast, memory-light).
uniq = pd.Index(pd.unique(keys))
onehot = np.zeros((adata.n_obs, len(uniq)), dtype=np.float32)
for i, k in enumerate(uniq):
    onehot[keys == k, i] = 1.0

X = adata.X
psbulk = (X.T @ onehot).T if hasattr(X, 'dot') else onehot.T @ X
psbulk = np.asarray(psbulk)   # (n_pseudobulk, n_genes)

n_cells = onehot.sum(axis=0)                # cells per pseudobulk sample
n_counts = psbulk.sum(axis=1)               # total counts per pseudobulk sample
keep = (n_cells >= 10) & (n_counts >= 1000)
psbulk = psbulk[keep]
uniq   = uniq[keep]

pb_parts = pd.Series(uniq).str.split('|', expand=True)
pb_obs = pd.DataFrame({
    'donor':     pb_parts[0].values,
    'condition': pb_parts[1].values,
    'cell_type': pb_parts[2].values,
}, index=uniq)

pb = ad.AnnData(X=psbulk, obs=pb_obs, var=adata.var.copy())

print(f'Pseudobulk AnnData shape: {pb.shape}  (samples x genes)')
print('\nsamples per cell type (ctrl + stim):')
print(pb.obs.groupby('cell_type', observed=True).size()
            .sort_values(ascending=False))
Pseudobulk AnnData shape: (112, 15706)  (samples x genes)

samples per cell type (ctrl + stim):
cell_type
B cells              16
CD14+ Monocytes      16
CD4 T cells          16
Dendritic cells      16
FCGR3A+ Monocytes    16
NK cells             16
CD8 T cells          14
Megakaryocytes        2
dtype: int64
4. Pseudobulk DE with pylimma (per cell type)
For each cell type, fit the full pipeline on the subset of pseudobulk samples belonging to that cell type. The design has intercept + stim indicator; the contrast tests stim - ctrl.
[5]:
per_ct_results = {}
for ct in sorted(pb.obs['cell_type'].unique()):
    pb_ct = pb[(pb.obs['cell_type'] == ct).values].copy()
    # Skip cell types with too few replicates (e.g. Megakaryocytes in
    # Kang are rare enough that some cases lose one or both conditions).
    if pb_ct.obs['condition'].nunique() < 2 or pb_ct.shape[0] < 4:
        print(f'{ct:20s}: skipped ({pb_ct.shape[0]} samples)')
        continue

    # Design: intercept + stim indicator. Contrast = stim effect.
    design = np.column_stack([
        np.ones(pb_ct.shape[0]),
        (pb_ct.obs['condition'] == 'stim').astype(float).values,
    ])
    C = np.array([[0.0], [1.0]])

    # Fully AnnData-native pipeline. pylimma handles orientation and
    # the voom -> lm_fit weights handshake internally.
    pylimma.voom(pb_ct, design=design)
    pylimma.lm_fit(pb_ct, design=design, layer='voom_E')
    pylimma.contrasts_fit(pb_ct, contrasts=C)
    pylimma.e_bayes(pb_ct)
    tt = pylimma.top_table(pb_ct, coef=0, number=np.inf, sort_by='p')

    per_ct_results[ct] = tt
    n_sig = (tt['adj_p_value'] < 0.05).sum()
    print(f'{ct:20s}: {n_sig:5,} genes at adj_p_value < 0.05 '
          f'({pb_ct.shape[0]} pseudobulk samples)')
B cells             :   836 genes at adj_p_value < 0.05 (16 pseudobulk samples)
CD14+ Monocytes     : 5,079 genes at adj_p_value < 0.05 (16 pseudobulk samples)
CD4 T cells         : 1,162 genes at adj_p_value < 0.05 (16 pseudobulk samples)
CD8 T cells         :   177 genes at adj_p_value < 0.05 (14 pseudobulk samples)
Dendritic cells     : 1,105 genes at adj_p_value < 0.05 (16 pseudobulk samples)
FCGR3A+ Monocytes   : 1,263 genes at adj_p_value < 0.05 (16 pseudobulk samples)
Megakaryocytes      : skipped (2 samples)
NK cells            :   493 genes at adj_p_value < 0.05 (16 pseudobulk samples)
5. Top IFN-stimulated genes per cell type
Check the top hits. The canonical IFN response signature includes ISG15, IFI6, IFIT1, IFIT3, IFI44L, MX1, OAS1, OAS3, STAT1, IRF7
these should appear near the top of every cell type’s table, with larger logFC in myeloid populations (CD14+ Monocytes, DCs) than in lymphocytes, reproducing Kang’s published finding.
[6]:
for ct, tt in per_ct_results.items():
    top5 = tt.head(5)[['log_fc', 'ave_expr', 'p_value', 'adj_p_value']]
    top5.index.name = f'top5 in {ct}'
    print(top5.round(3))
    print()
                 log_fc  ave_expr  p_value  adj_p_value
top5 in B cells
ISG20             3.176    11.333      0.0          0.0
B2M               0.645    15.097      0.0          0.0
ISG15             5.520    10.242      0.0          0.0
LY6E              4.093     8.821      0.0          0.0
RPL10            -0.498    13.210      0.0          0.0

                         log_fc  ave_expr  p_value  adj_p_value
top5 in CD14+ Monocytes
ISG20                     5.279    10.232      0.0          0.0
IL1RN                     6.177     7.938      0.0          0.0
IFITM2                    4.322     7.986      0.0          0.0
IFIT3                     7.196     8.372      0.0          0.0
CCL8                      9.182     9.335      0.0          0.0

                     log_fc  ave_expr  p_value  adj_p_value
top5 in CD4 T cells
ISG20                 2.955    10.427      0.0          0.0
IFI6                  5.600     8.540      0.0          0.0
MT2A                  4.176     7.802      0.0          0.0
LY6E                  4.030     8.576      0.0          0.0
ISG15                 4.994    10.135      0.0          0.0

                     log_fc  ave_expr  p_value  adj_p_value
top5 in CD8 T cells
ISG20                 3.585    10.954      0.0          0.0
RPL3                 -0.511    12.883      0.0          0.0
RPS6                 -0.491    12.640      0.0          0.0
ISG15                 4.437    10.906      0.0          0.0
IFIT3                 5.821     8.504      0.0          0.0

                         log_fc  ave_expr  p_value  adj_p_value
top5 in Dendritic cells
B2M                       0.630    15.128      0.0          0.0
ISG20                     3.880    10.744      0.0          0.0
FTH1                     -0.830    15.587      0.0          0.0
ISG15                     6.602    11.369      0.0          0.0
TNFSF10                   8.402     7.439      0.0          0.0

                           log_fc  ave_expr  p_value  adj_p_value
top5 in FCGR3A+ Monocytes
MALAT1                     -0.113    15.727      0.0          0.0
B2M                         0.151    15.192      0.0          0.0
TMSB4X                     -0.994    15.012      0.0          0.0
FTH1                       -0.905    16.910      0.0          0.0
ISG20                       4.424    10.550      0.0          0.0

                  log_fc  ave_expr  p_value  adj_p_value
top5 in NK cells
B2M                0.383    15.676      0.0          0.0
GNLY               0.498    14.046      0.0          0.0
ISG15              4.479    11.095      0.0          0.0
FTH1              -0.398    14.127      0.0          0.0
ISG20              3.439    11.072      0.0          0.0
References
Kang HM et al. (2018). Nat Biotechnol 36:89-94.
Squair JW et al. (2021). Nat Commun 12:5692.
Crowell HL et al. (2020). Nat Commun 11:6077.
Murphy AE, Skene NG (2022). Nat Commun 13:7851.